Measuring up 2019
Editor’s note: Readers should remember that Shoshone County statistics for each category and measure are compared to Idaho State averages in parentheses, unless otherwise explained.
By CHANSE WATSON
Managing Editor
Shoshone County continues to round out the bottom five in overall health scores compared to the other counties in Idaho.
While there are few factors that have seen improvement, the 10th annual Robert Wood Johnson Foundation and University of Wisconsin Population Health Institute 2018 County Health Rankings show that Shoshone County still has a lot of work to do to get healthier.
According to the report, our slice of Idaho ranks 38 out of 42 participating Idaho counties in terms of overall health. While this is a low position, the 38th spot is a small improvement, as the county has held the rank of 41 for the past two years.
Shoshone County edged out Bingham, Gooding, Benewah and Owyhee counties to get this new position.
For those who know that Idaho has 44 counties (not 42), Clark and Camas counties were once again not ranked due to missing information.
This slight bump in placing from last year doesn’t necessarily imply that nothing has gotten better. In fact, many categories that ranked poorly in 2017 report made slight improvements. These few positives were once again offset though by many other categories that got worse or remained poor.
The county rankings are determined based on summary composite scores in two main categories that are calculated from sub-categories and individual measures (policies or programs).
The Health Outcomes main category (accounts for 50 percent of the overall score) is determined based on scores in two sub-categories — Length of Life (50 percent) and Quality of Life (50 percent). The Health Factors main category (accounts for the other 50 percent of the overall score) is slightly more complex, as it is determined by the rankings of four sub-categories — Health Behaviors (30 percent), Clinical Care (20 percent), Social & Economic Factors (40 percent) and Physical Environment (10 percent).
The final scores of the categories are then compared to the other counties so it can all be ranked.
Regarding the main category of Health Outcomes for Shoshone County, its overall rank of 38 out of 42 Idaho counties is largely influenced by the Length of Life sub-category, which also sits at 38. The county’s number of years of potential life lost before the age of 75 per 100,000 in the population dropped to 9,600 (compared to the state average of 6,300) and was the main reason for the poor Length of Life marks.
Quality of Life (23 out of 42 Idaho counties) measures on the other hand stood up to state averages much better than Length of Life, but were still slightly above or equal to them.
On the Health Factors main category side of things (40 out of 42), Shoshone County took hard hits in the Social & Economic Factors (42 out of 42) and Health Behaviors (31 out of 42) sub-categories.
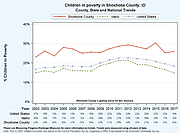
The report identified six of the nine measures in Social & Economic Factors as areas to explore (or areas to work on). These poor measures include a low high school graduation rate (83 percent compared to last year’s rate of 89 percent), a low number of adults with some college education (50 percent compared to the state average of 65 percent), a high unemployment rate (6.3 percent compared to the state average of 3.2 percent), a high number of injury related deaths per 100,000 in the population (144 compared to 73), a high number of reported violent crimes per 100,000 in the population (396 compared to 221) and a disturbingly high percentage of children in poverty (26 percent compared to 15 percent).
A strong showing in the number of membership associations per 100,000 in the population measure (12.8 compared to 7.4) was not nearly enough to offset the other poor scores.
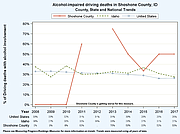
Health Behaviors improved slightly from last year and only showed three measures that needed to be worked on. The percentage of adult smokers in the county has remained unchanged from last year at 16 percent, but the percentage of obese adults has slightly dropped from 30 percent to 29 percent (still classified as an area to explore). Unfortunately, the glaring percentage of alcohol-impaired driving deaths (52 percent compared to the state’s 31 percent) has not changed from 2017 and continues to lower the county’s average score.
Ironically, Shoshone County once again shows positive numbers in the percentage of adults with access to exercise opportunities (93 percent compared to 78 percent) and percentage of adults that excessively drink (14 percent compared to 17 percent).
Clinical Care (21 out of 42) and Physical Environment (15 out of 42) were some of the only sub-categories where positive measure numbers outweighed (or came close to outweighing) the negatives.
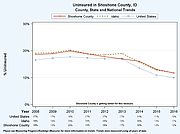
The percentage of the population under 65 without health insurance improved to 12 percent and is now in-line with the state average (compared to 13 percent last year for both). An improved number of hospital stays for ambulatory-care sensitive conditions (2,846 per 100,000 compared to 2,696) also helps keep Shoshone County’s Clinical Care ranking in the middle of the pack. These positive statistics are countered though by the ratio of the population with access to a primary care physician (2,490:1 compared to 1,550:1) and a low percentage of female Medicare enrollees age 65-74 that received an annual mammography screening (44 percent compared to 58 percent). In a new measure that looks at the percentage of fee-for-service (FFS) Medicare enrollees that had an annual flu vaccination, the county’s 38 percent fared well compared to the state’s average of 39 percent.
Once again, the sub-category Shoshone County scored best in was Physical Environment — which saw adequate numbers in the measures for driving to work alone (75 percent of the workforce compared to 79 percent), having a long commute to work alone (20 percent of workers compared to 23 percent), drinking water violations (no violations) and severe housing problems (14 percent of households compared to 16 percent).
The air pollution measure used to be one of the few strengths the county had, but now it has switched to being an area to work on. The report shows that the average daily density of fine particulate matter is now 9.7 micrograms per cubic meter, compared to what it was last year at 6.6 and the current state average of 7.4.
To see the full report, visit www.countyhealthrankings.org and search for Shoshone County.


